The Polling Center at Jackson State University’s Institute of Government (IOG) has released a national survey that reveals some people lie when responding to biased questions and many prefer cash and the Internet for their participation.
The “Poll on Research and Polling” was conducted Aug. 12-20 and involved 1,000 adults explaining their national views on market and social research as well as public polling.
Dr. Otha Burton Jr., associate professor and executive director of IOG, has conducted research with The Center for Research and Public Policy for the past four years. For this latest survey, IOG and the Center for Research put a microscope on the very nature that polling has evolved into in the 21st century.
 Burton said, “The polling culture has eclipsed scientific research, marketing and even politics” compared to the previous century. “Particularly in politics and policymaking … polling is in your face, aggressive, perceived as biased, outcome-driven. Frequently, the public is left unsure what trending is to be trusted.”
Furthermore, Burton said, “Results of the survey suggest that nonprofits, higher education and social markets fair better and that government, the media and lobbying groups are significantly less trusted. However, culture ‘must’ congeal to ensure the processes, data derived and overall public benefits are worth all of our efforts. After all, it’s about people and the greater good for America and, indeed, this planet in which we live.”
Among the results
-
Majority of Americans surveyed/polled cite bias or “leading questions” in surveys completed
-
Large majorities see value in market or social research and public polling
-
Public polling is seen as more biased than market or social research
-
Nonprofits and college and university polling institutes/centers are viewed as the most credible sponsors of public polling
-
Media, political parties, candidates and lobbying firms are seen as the least credible sponsors of public polling
-
Some respondents admit to lying to pollsters when confronted with bias or “leading questions”
On Awareness of Social /Market Research and Public Polling
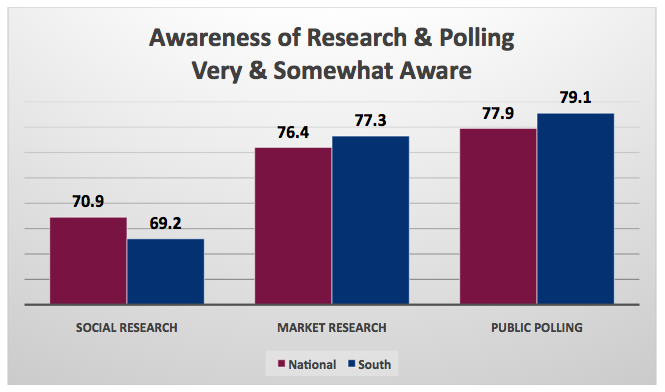 Among three common types of research covered in this JSU Poll (social research, market research and public polling), awareness was strongest (very and somewhat aware) for public polling (77.9%) followed by social and market research, 70.9% and 76.4%, respectively.
Similarly, public polling was followed most closely by respondents – 54.6% suggesting very and somewhat closely. This was followed by social and market research, 48.9% and 49.2%, respectively.
On Value and Importance of Research
Large majorities of JSU poll respondents placed value on research and polling in the U.S. and considered such efforts important:
- Research and polling helps sponsors design or improve products and services as well as formulate policies or improve laws/legislation – 86.8% strongly or somewhat agree
- Research benefits consumers of goods and services in the U.S. – 86.7% strongly or somewhat agree
- Polling on issues helps constituents/residents in the U.S. with better policies and laws – 75.1% strongly or somewhat agree
On Credibility of Research Types and Sponsors
 Only about one-quarter of all respondents believed research and polling is unbiased and fair. Those considering social research, market research and public polling “fair and unbiased” were 25.8%, 29.7% and 24.8%, respectively.
Larger percentages of respondents considered these types of research “biased and unfair” – social research (32.7%), market research (31.9%) and public polling (37.2%).
The most credible and believable sponsors of public polls were nonprofits and academia (including college/university polling institutes) – 42.0% and 40.8%, respectively.
These were followed by issue organizations and companies/private sector – 33.5% and 32.6%, respectively.
Interestingly, for several sponsors, more respondents considered their public polls “not at all believable” than “believable.” These included government agencies (28.4% to 33.8%), the media (28.3% to 40.8%), political parties (23.5% to 43.9%), candidates for public office (22.7% to 43.6%) and lobbying firms (21.1% to 45.6%).
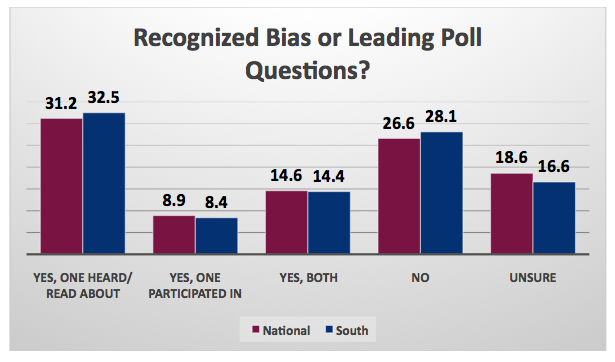
Importantly, a majority (54.7%) of all respondents indicated that they have witnessed bias or leading questions in polling that they have seen or participated in.
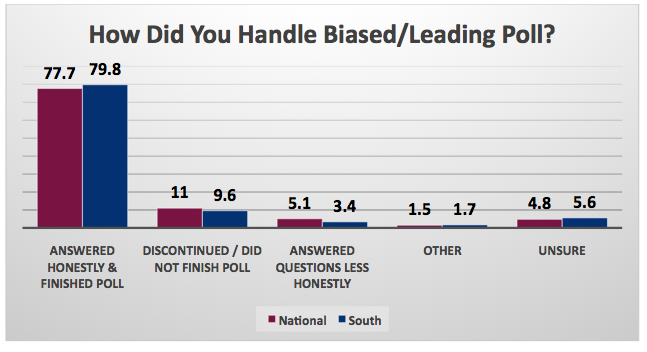
While most (77.7%) answered questions in biased polls honestly, others discontinued/ended the poll (11.0%) or answered questions less than honestly (5.1%) when they witnessed bias or “leading questions.”
On Participation in Research & Polling
While one-third, 32.3%, of all Americans surveyed suggested they complete one to less than 10 surveys or polls each year, some completed 10-under 25, 25-under 50, 50-under 75, 75-under 100, or 100 or more annually – 20.2%, 11.7%, 5.7%, 3.6% and 7.4%, respectively.
Interest is greatest in polls covering the following topics (in declining order): healthcare, jobs/economy, education, immigration, government spending/deficit, taxes/tax rates, and crime.
A second tier of issues of interest included (in declining order): gun control/Second Amendment rights, terrorism, homeland security, gun violence, global climate change, Internet/data security/identity theft, and race relations.
On Preferred Venues for Participation
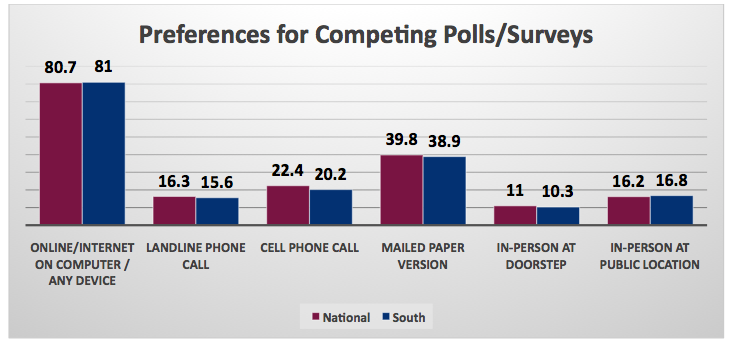 Significant percentages of Americans, 80.7%, selected Internet or online surveys when asked to report their preferred formats for completing surveys and polls. In a multiple response question, mailed/paper surveys was second in preferred frequency (39.8%) followed by cell phone call (22.4%), landline call (16.3%), in-person at a public location (16.2%), and in-person at the doorstep (11.0%).
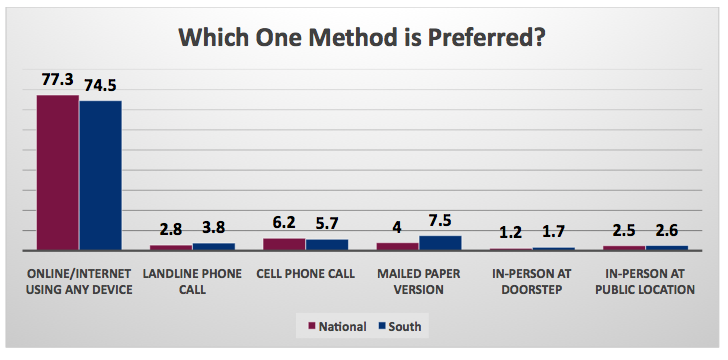 When asked to pick only one format for completing a survey or a poll, online/Internet lead (77.3%). This method was followed by cell phone, paper, landline, in-person/public location, and in-person at doorstep – 6.2%, 4.0%, 2.8%, 2.5% and 1.2%, respectively.
Interestingly, large percentages of respondents expressed a willingness to spend significant amounts of their own time with researchers completing polls and surveys. The largest group, 24.0% indicated they would spend from 10 minutes to less than 15 minutes on a poll or survey while 23.7%, suggested they would offer researchers from 15 minutes to less than 30 minutes. Fewer, 17.2%, would spend from five minutes to under 10 minutes with researchers. Those indicating under five minutes; from 30 minutes to under 45 minutes; and 45 minutes or longer were recorded at 6.2%, 7.5% and 4.0%, respectively. Some, 12.7%, noted it would depend on the topic.
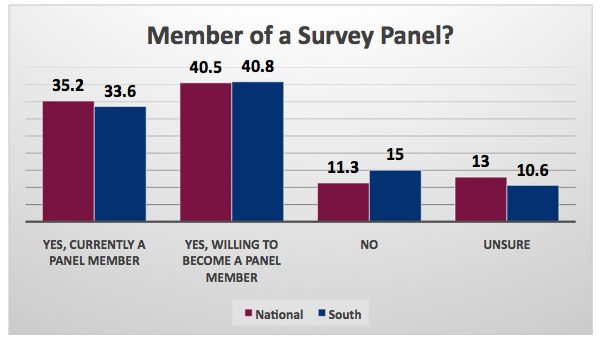 Just over one-third of all Americans surveyed, 35.2%, reported they were currently members of an online research panel, while 40.5% noted an interest in joining such an online research panel.
Those who are members of an online research panel were asked to report the number of panels they belong to today. The average number of panels they participate in is 2.45.
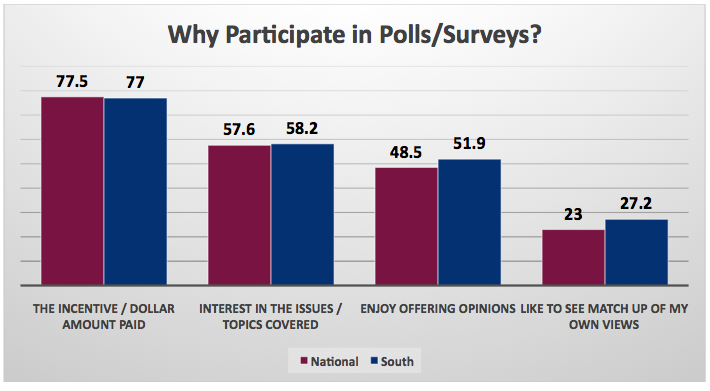
Participation in research panels is driven most by the incentive received (77.5%). This is followed by those, 57.6%, who note an interest in the issues or topics covered. Others, 48.5%, say they enjoy offering their own opinions in surveys or polls, and 23.0% like to see comparisons of their views with those of others.
On College Selection Criteria
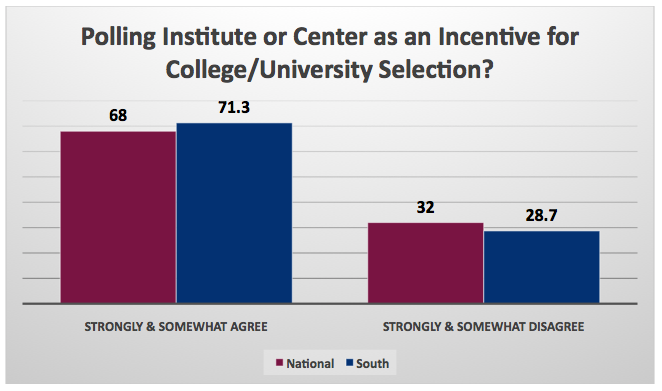 Interestingly, over two-thirds of all American parents surveyed (parents of college graduates, college students or middle/high school students bound for college), 68.0%, either strongly or somewhat agreed they would view a college/university with a polling institute/center more favorably in the college selection process – knowing students might learn the research/polling profession.
Other criteria for college/university selection among these parents included (in declining order): degrees/programs/majors, scholarships available, financial aid available, cost, value, location, job prospects, distance from home, quality of on-campus housing, work study availability, quality of academic research taking place and having online courses. Another 16 criteria, mentioned with less frequency, are cited within this report.
ABOUT THE POLL: The poll was conducted by The Polling Center at Jackson State University’s Institute of Government.
METHODOLOGY: The poll sampled opinions of 1,000 people approximately proportional to state population contribution nationwide. The survey was conducted Aug. 12-20. All surveys were conducted using an online survey instrument. The poll has a +/- 3.0 percent margin of error at a 95 percent confidence level on a composite basis.